PROBLEM:
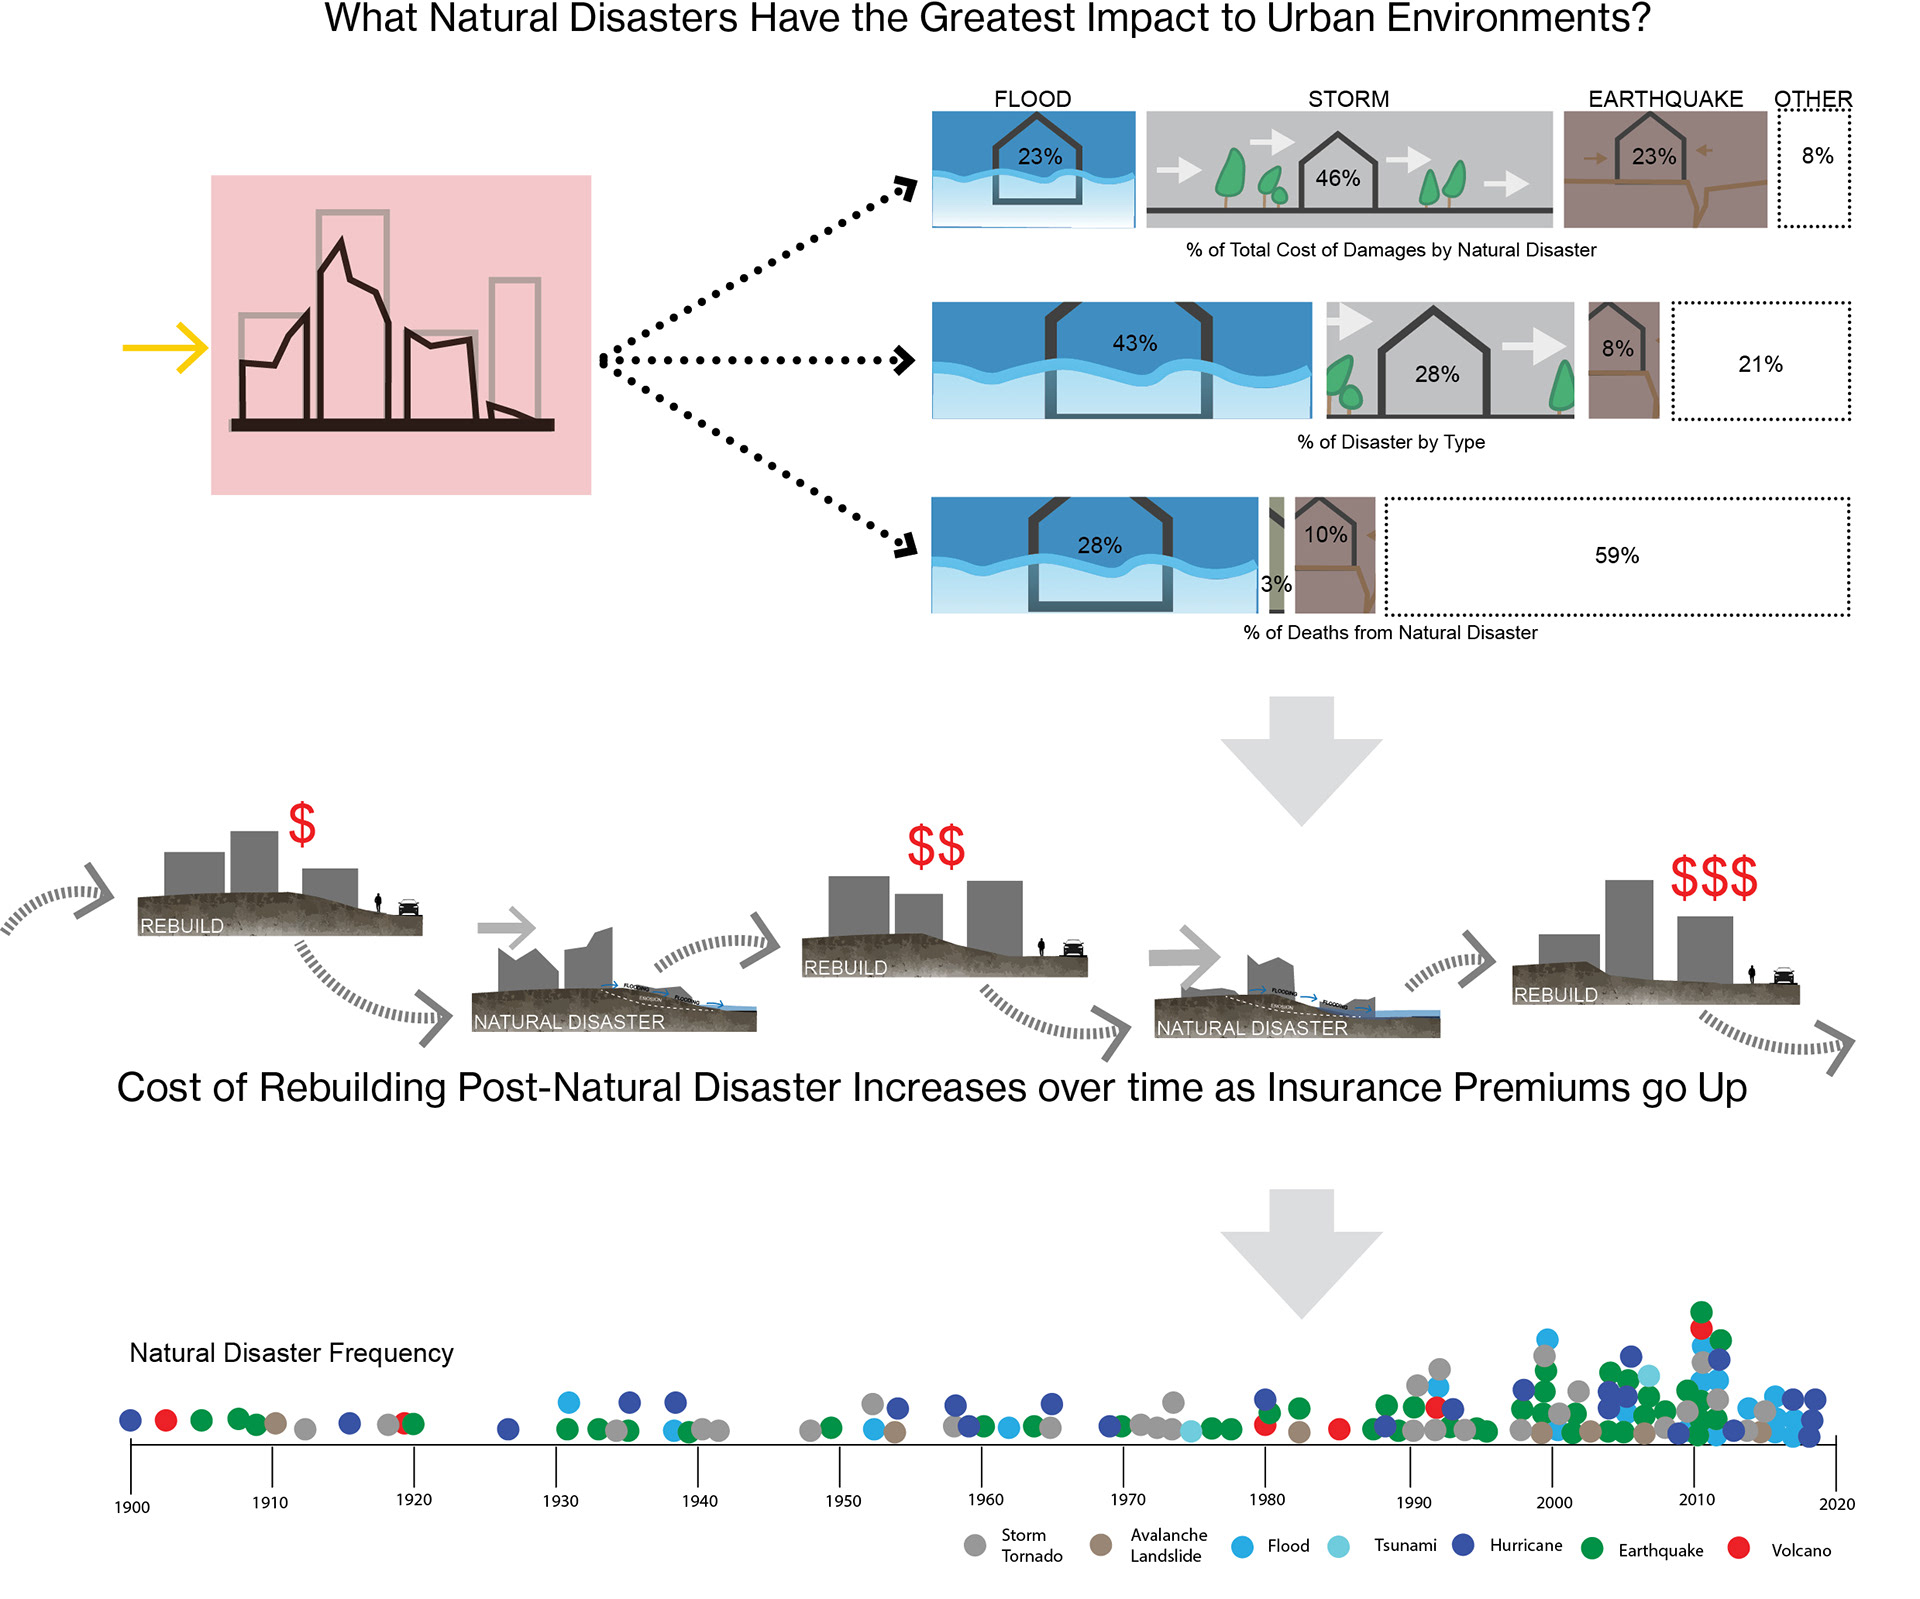
Nature builds through violent forces such as earthquakes, storms, fires, and floods. While patterns have emerged for when and where a disaster may strike, human settlements are often under prepared for the resulting devastation. However, nature has proven to be resilient to itself. Most plants do not fall over during an earthquake, swamp ecosystems reduce flooding while dampening the effects of tsunami waves, chaparral forests require fire to regrow. Is it possible to model a new urban fabric after these resilient ecosystems that could potentially reduce the destruction caused by natural disasters? Could the integration of ecosystems in urban design provide social benefits for communities in natural disaster prone areas while reducing the level of destruction?
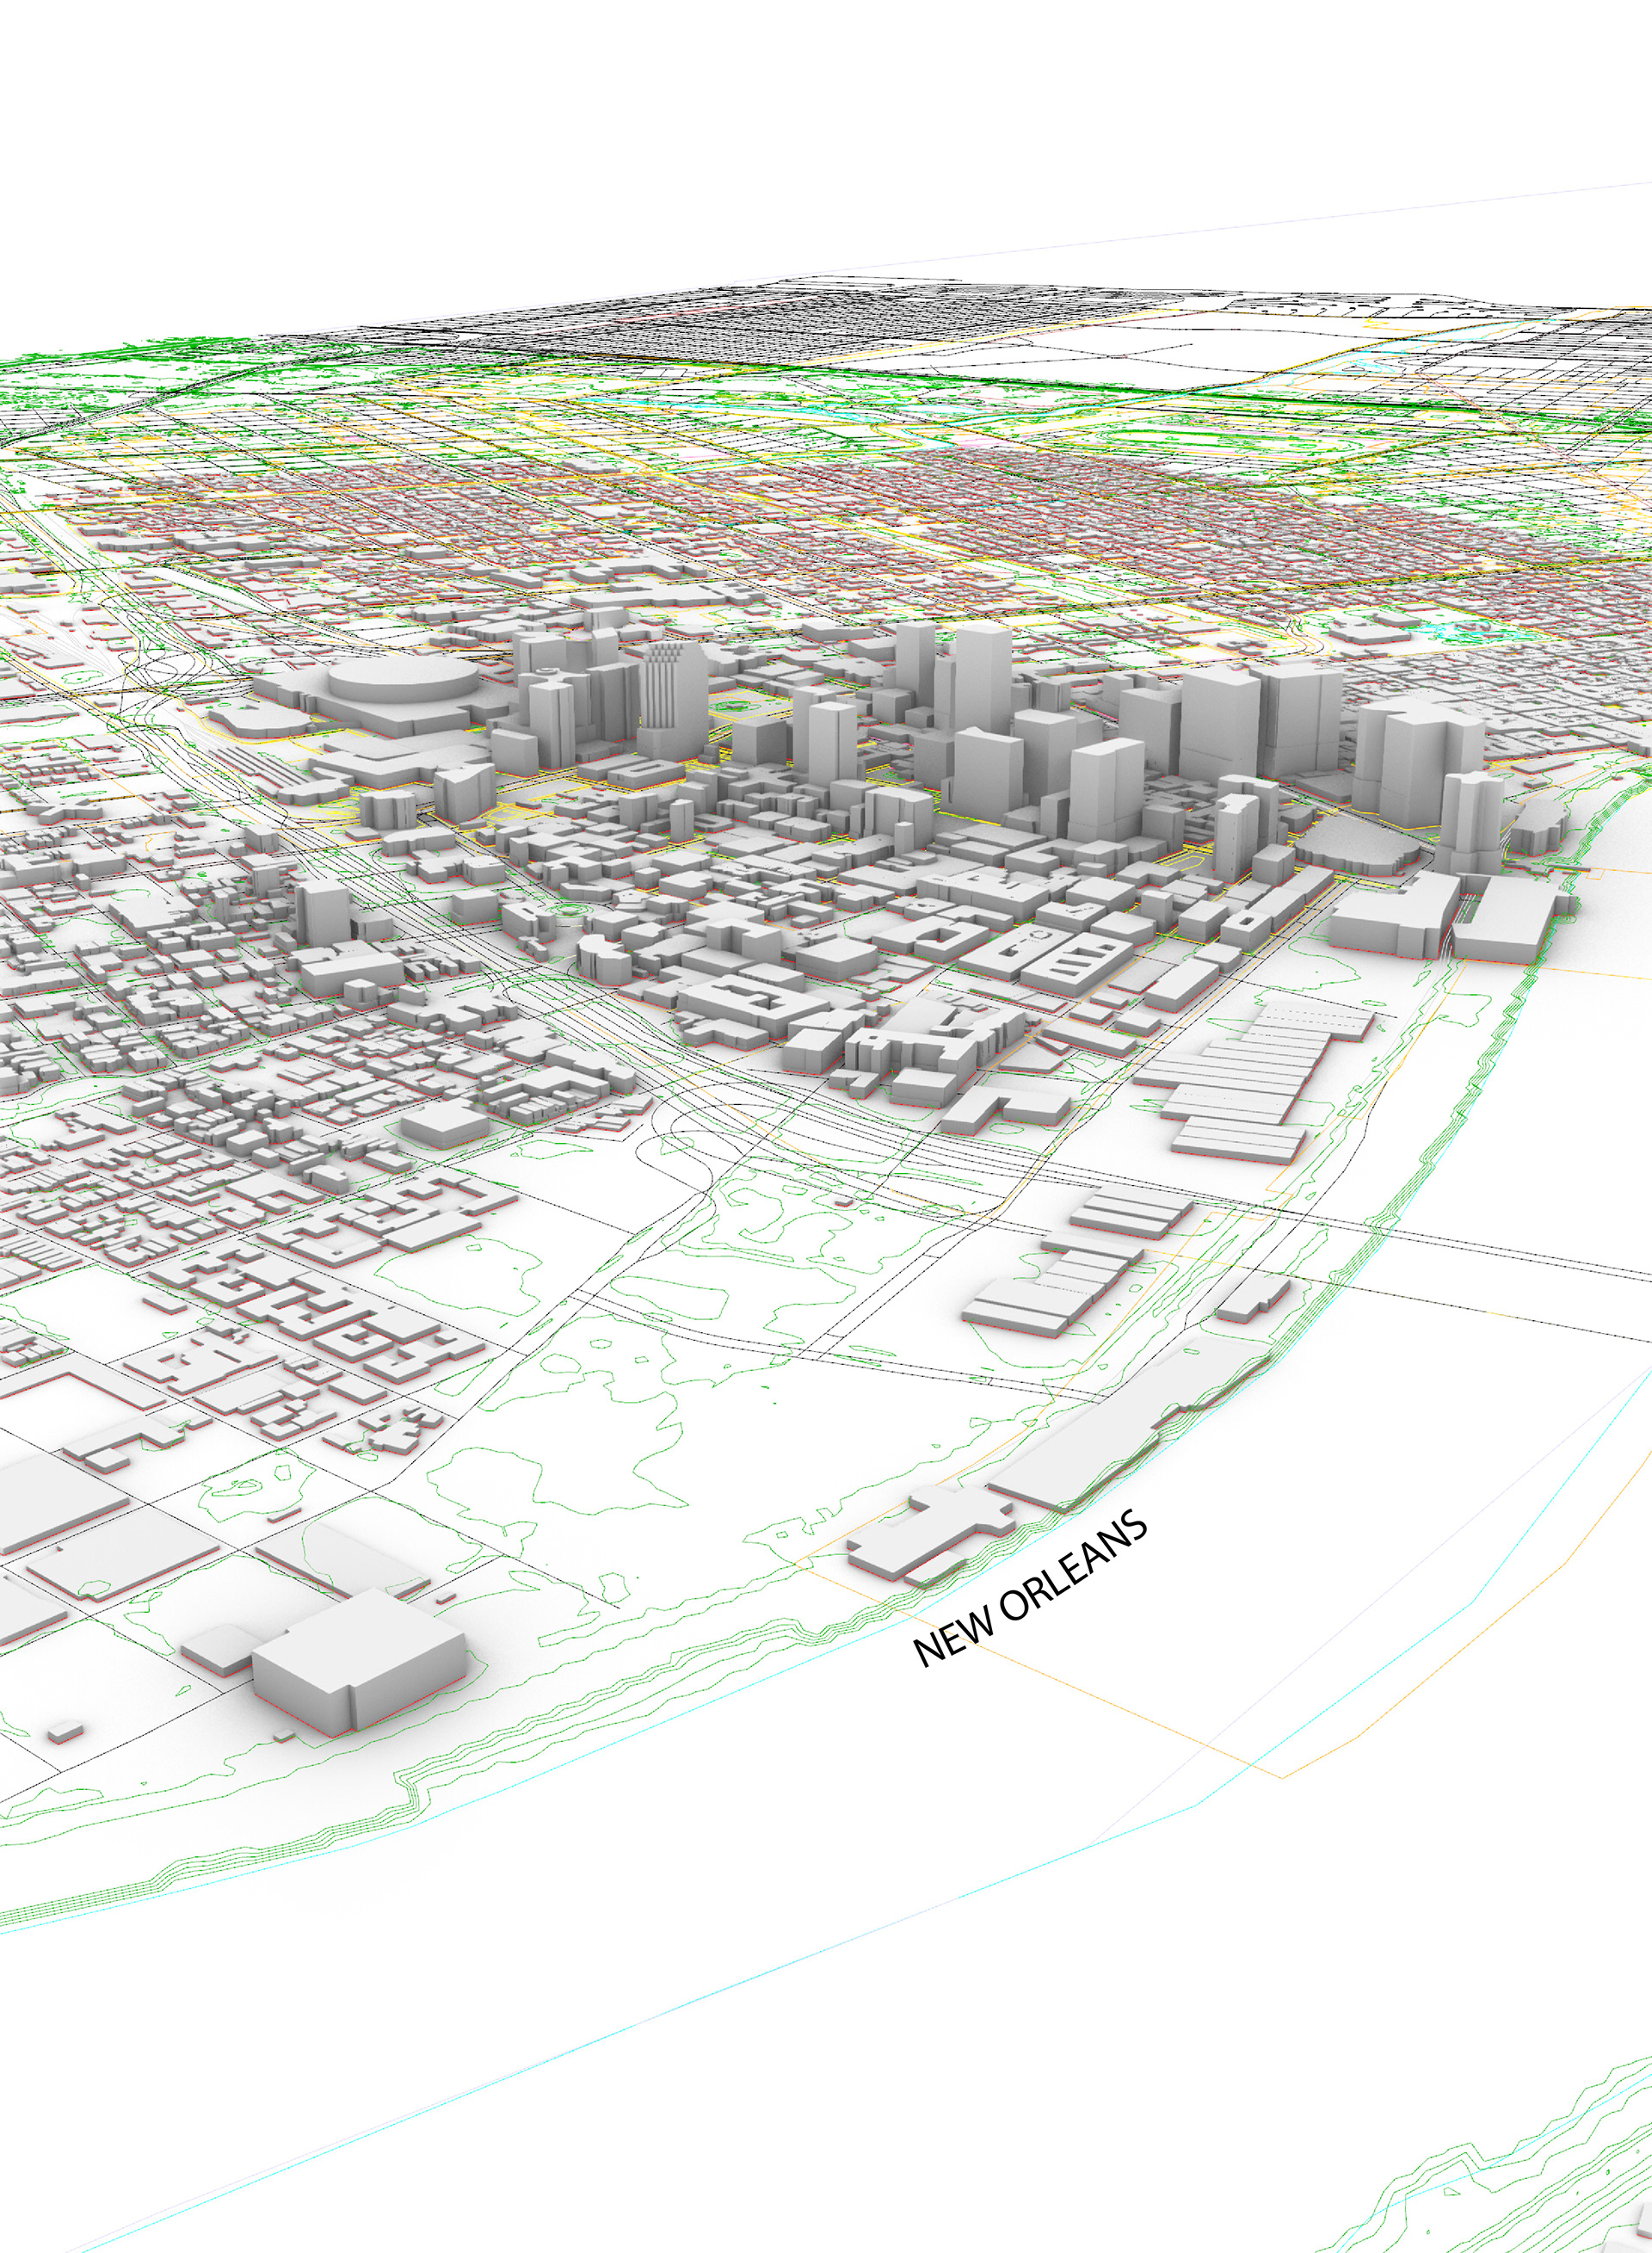
Two cities were identified as high risk natural disaster areas; Los Angeles and New Orleans. For this project, New Orleans was selected for further development. The current decrease in population, along with the increased number of vacancies, provides an opportunity to redevelop the city sustainably to encourage future growth.
THESIS:
Post natural disaster, this project proposes incorporating greenways along side more resilient building strategies. Through the incorporation of greenways and resilient building strategies that focus on form, a more natural disaster resilient urban environment can be created.
STRATEGY:
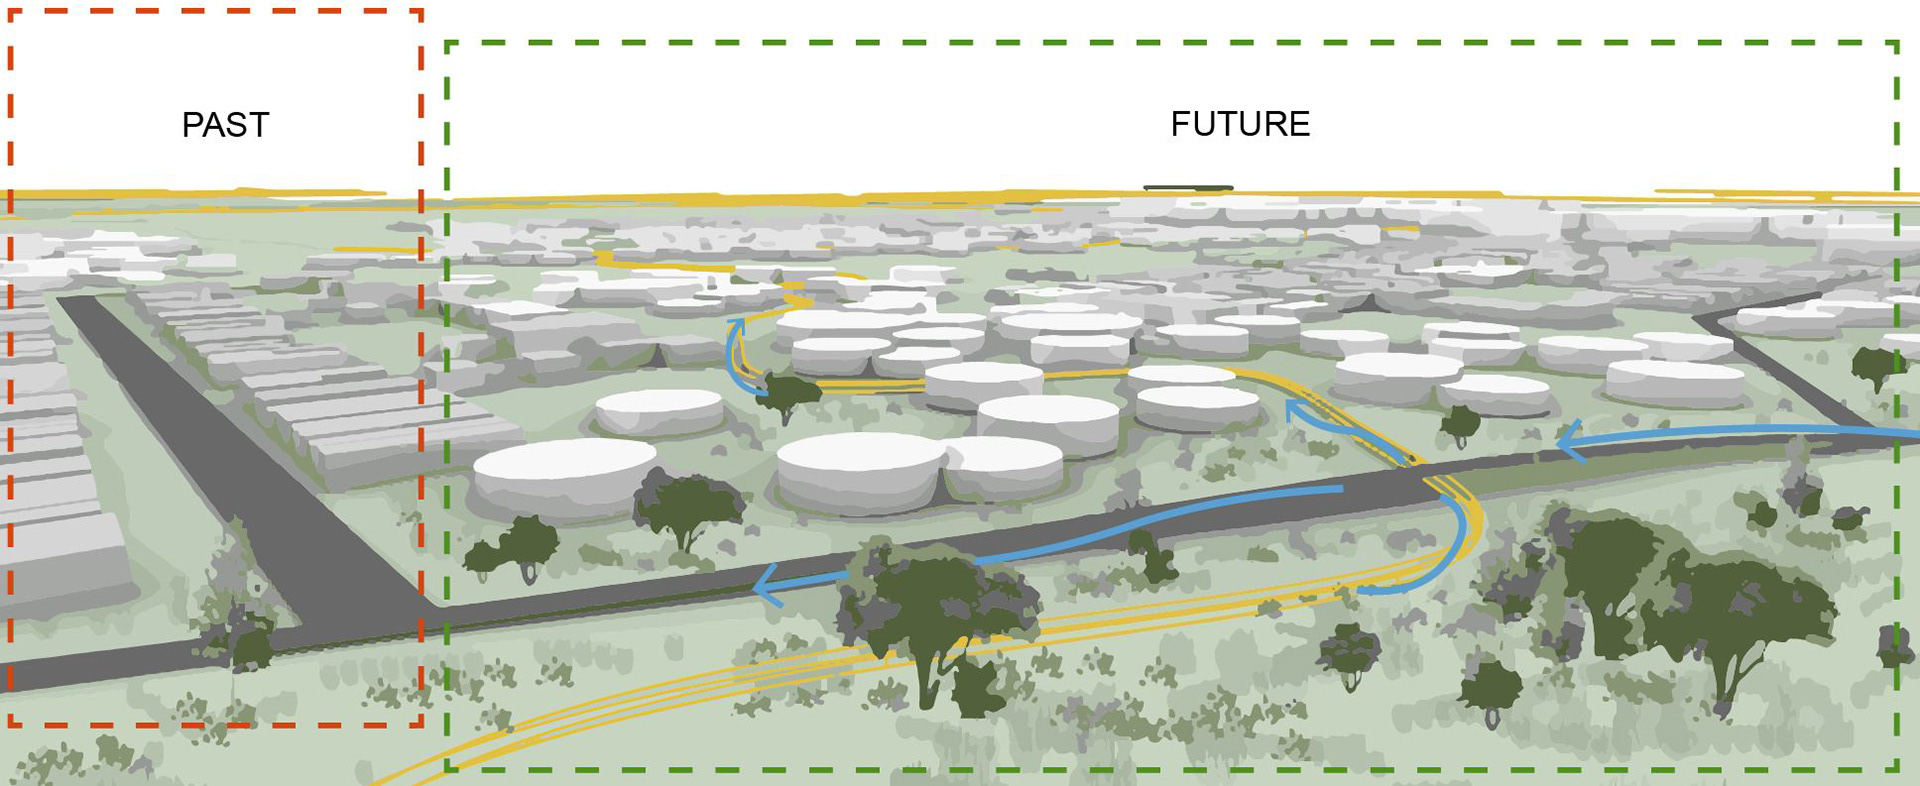
PART 1: A portion of each area destroyed by hurricanes and floods will be given back to nature in the form of greenways. These new greenway paths will work with circulation and utility patterns of the city to help redirect flood waters out of New Orleans.
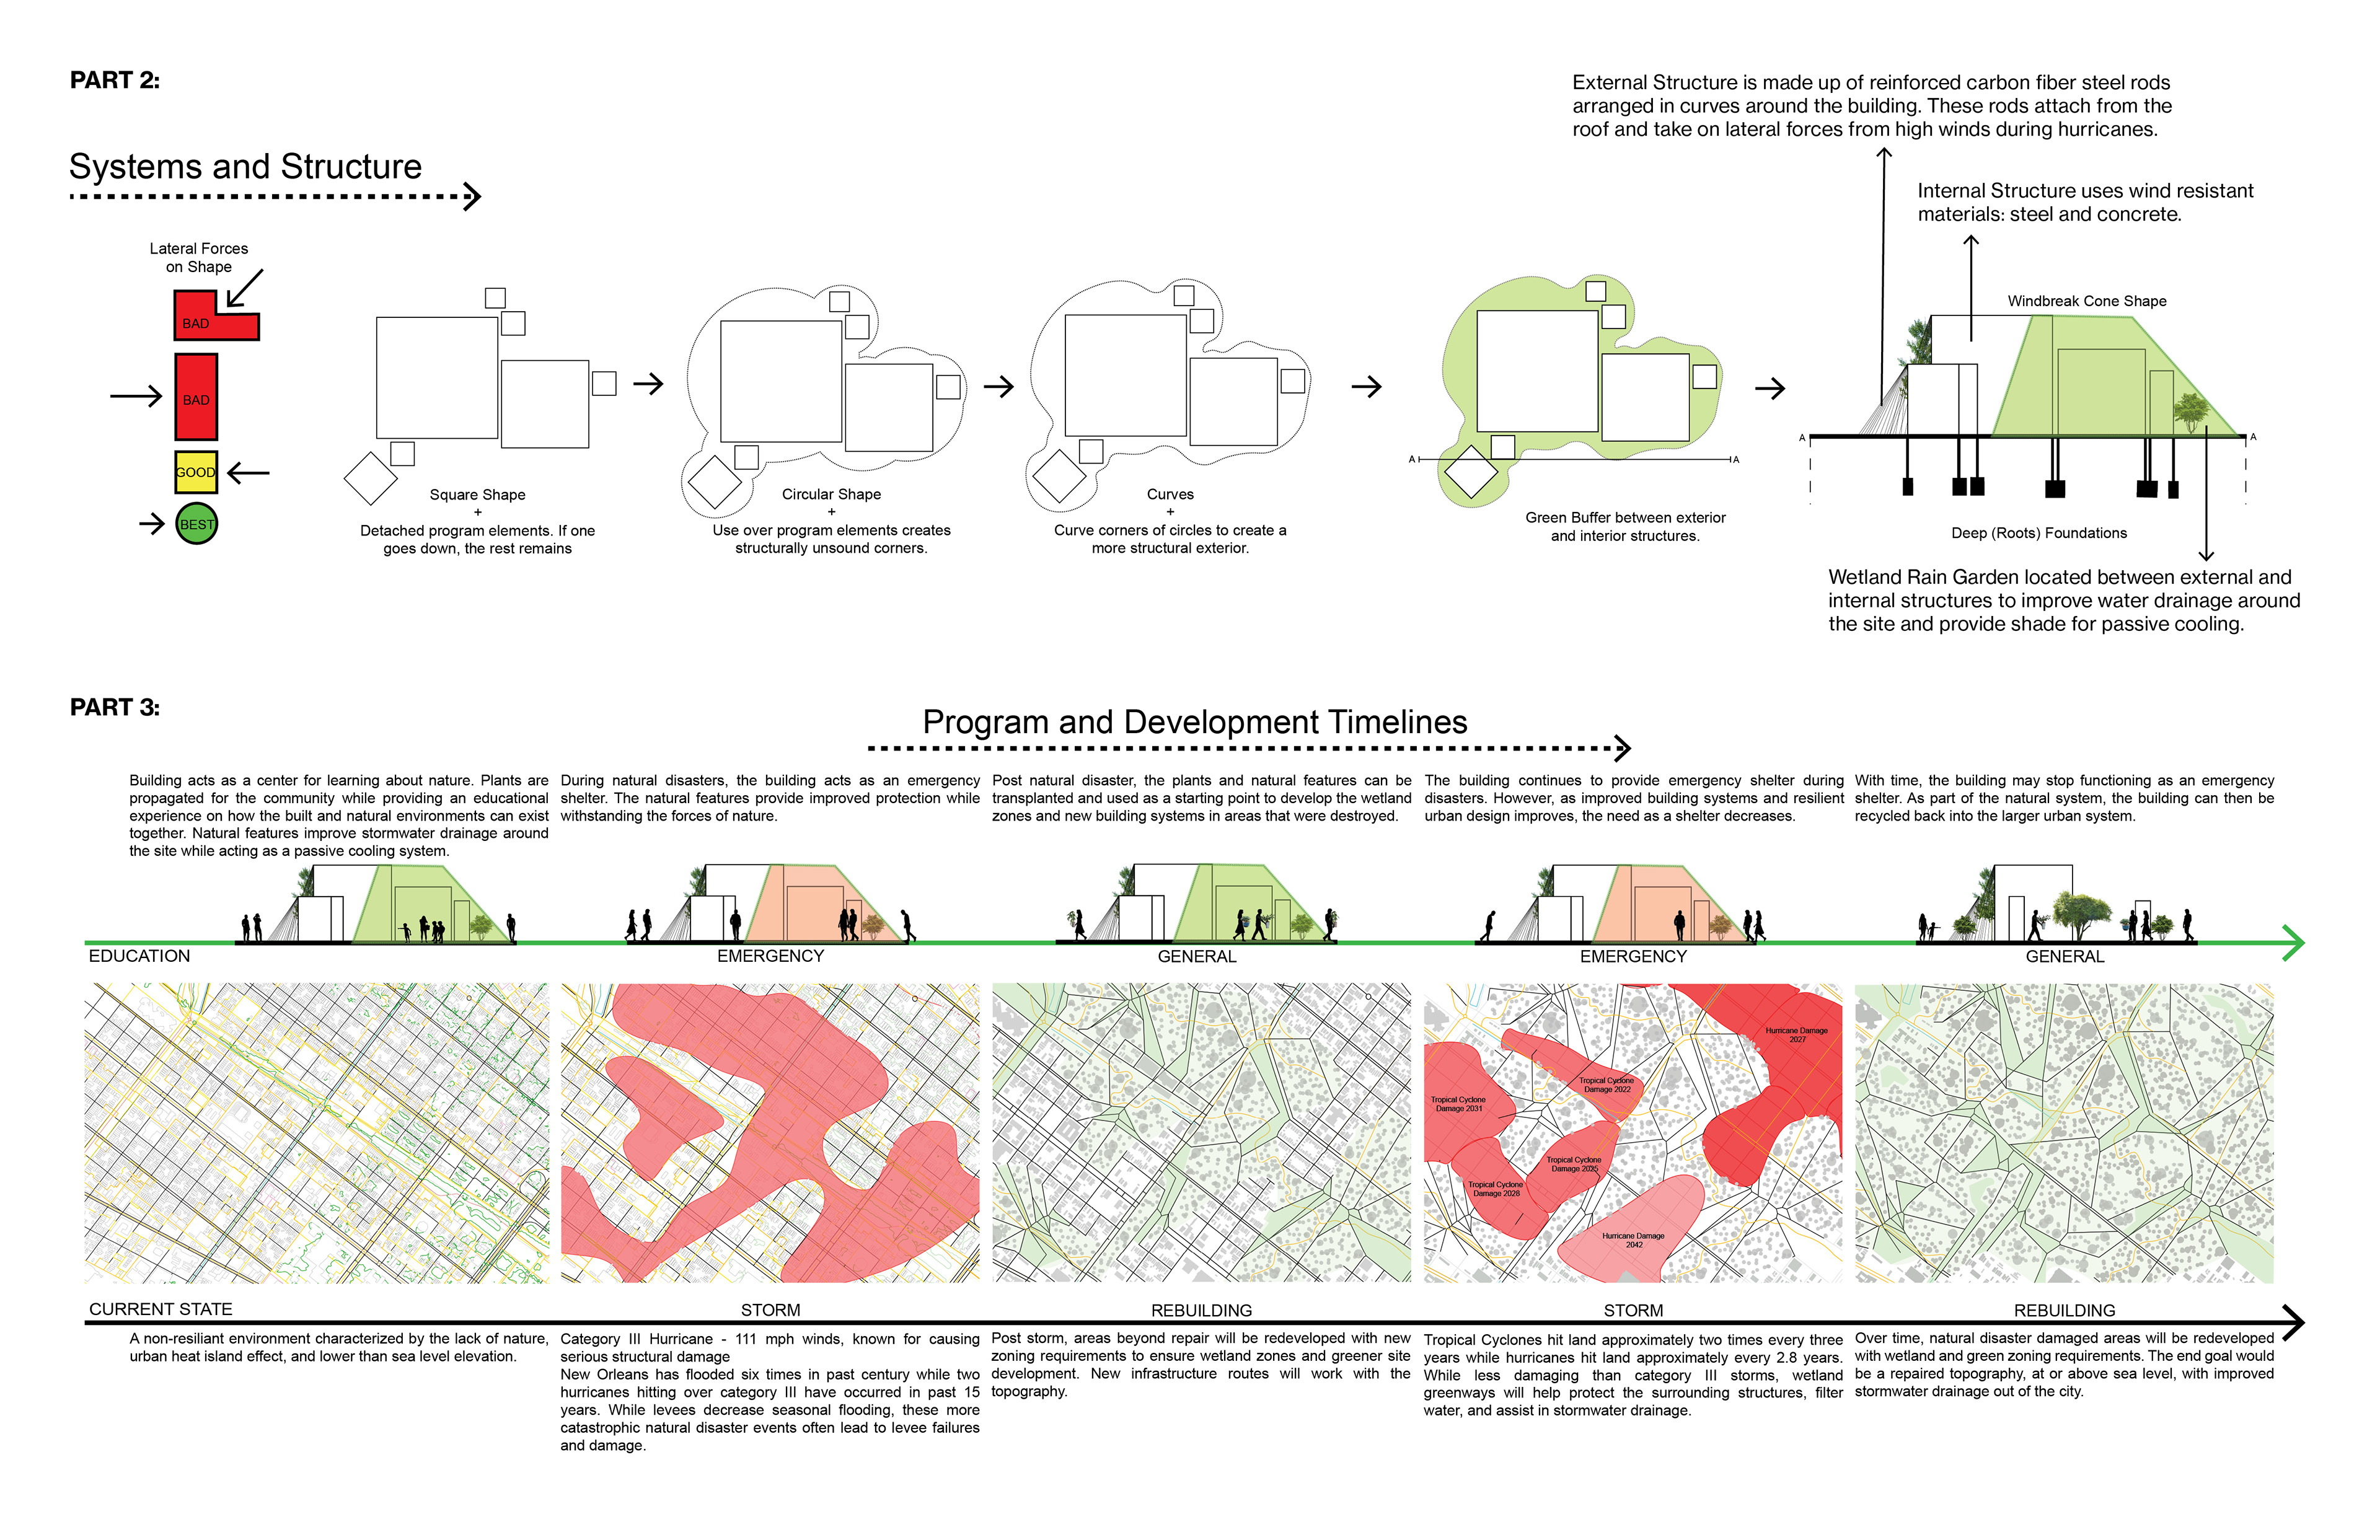
PART 2: Proposal of green building strategies that utilizes nature for passive systems and looks at lateral forces of nature for structural integrity.
PART 3: How urban design (Part 1) and building design (Part 2) come together.
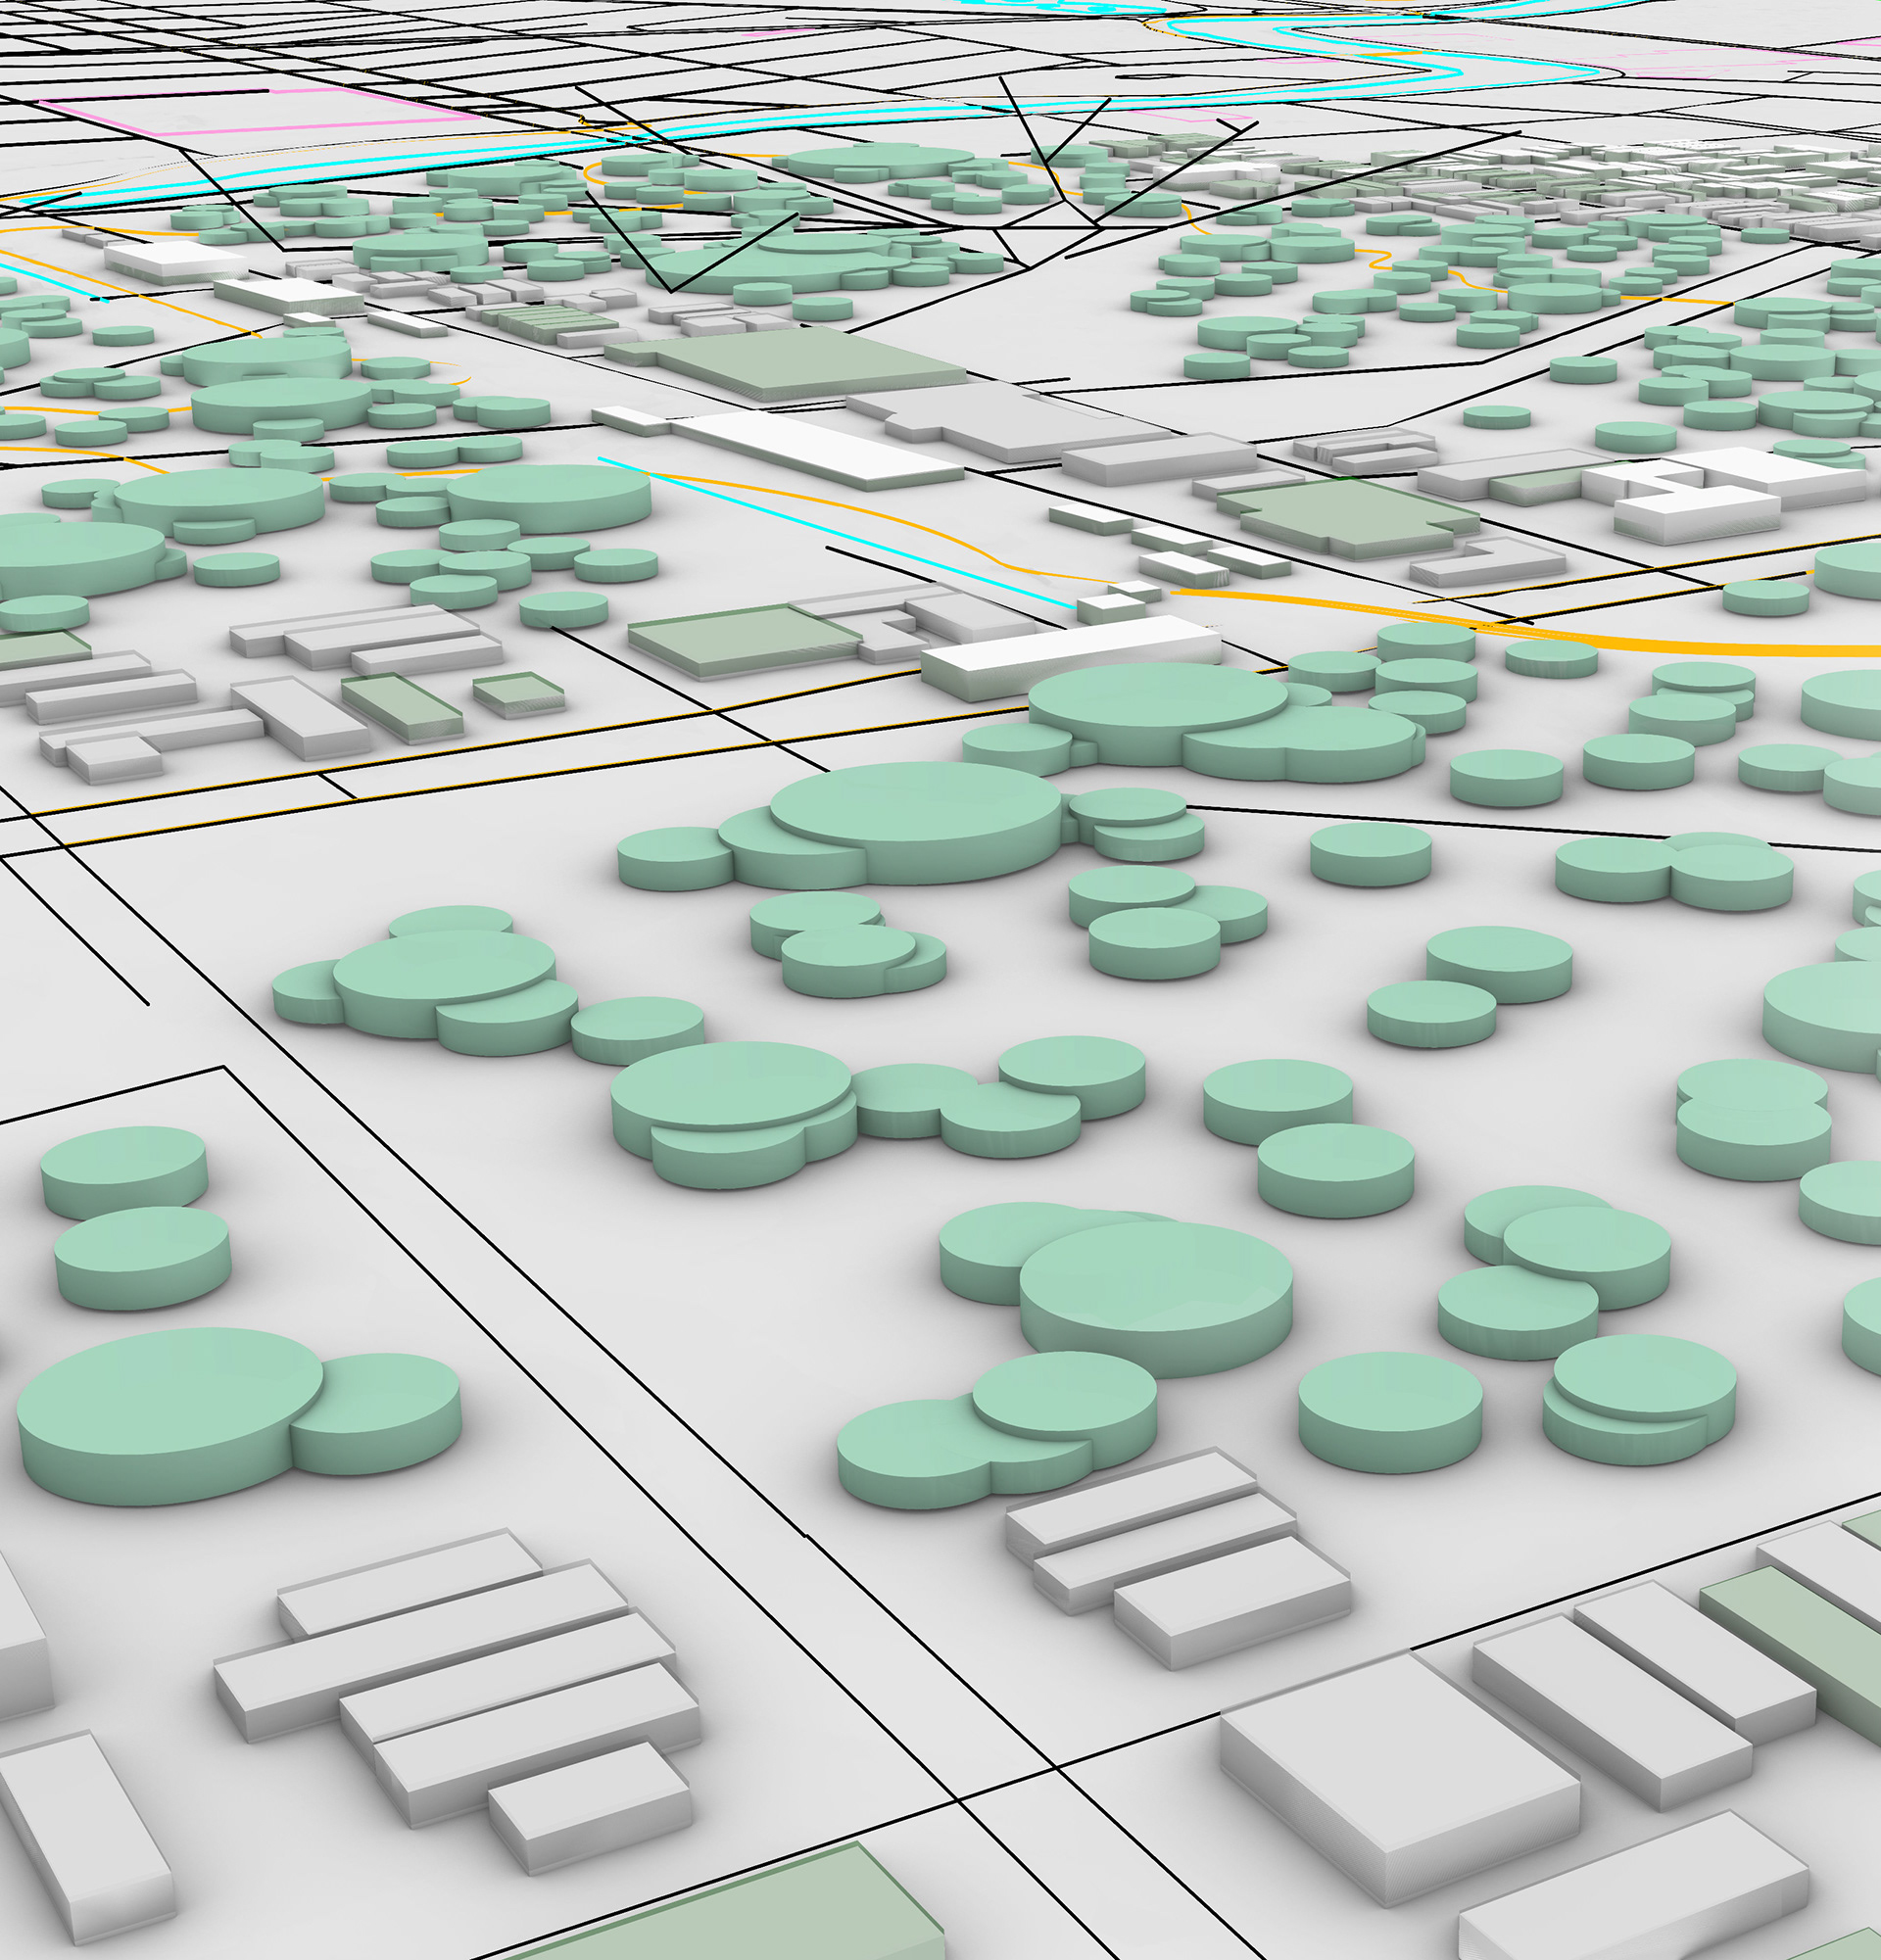
A city model of New Orleans was created in Rhino using Grasshopper then modified using randomization to mimic natural patterns in flood zones.
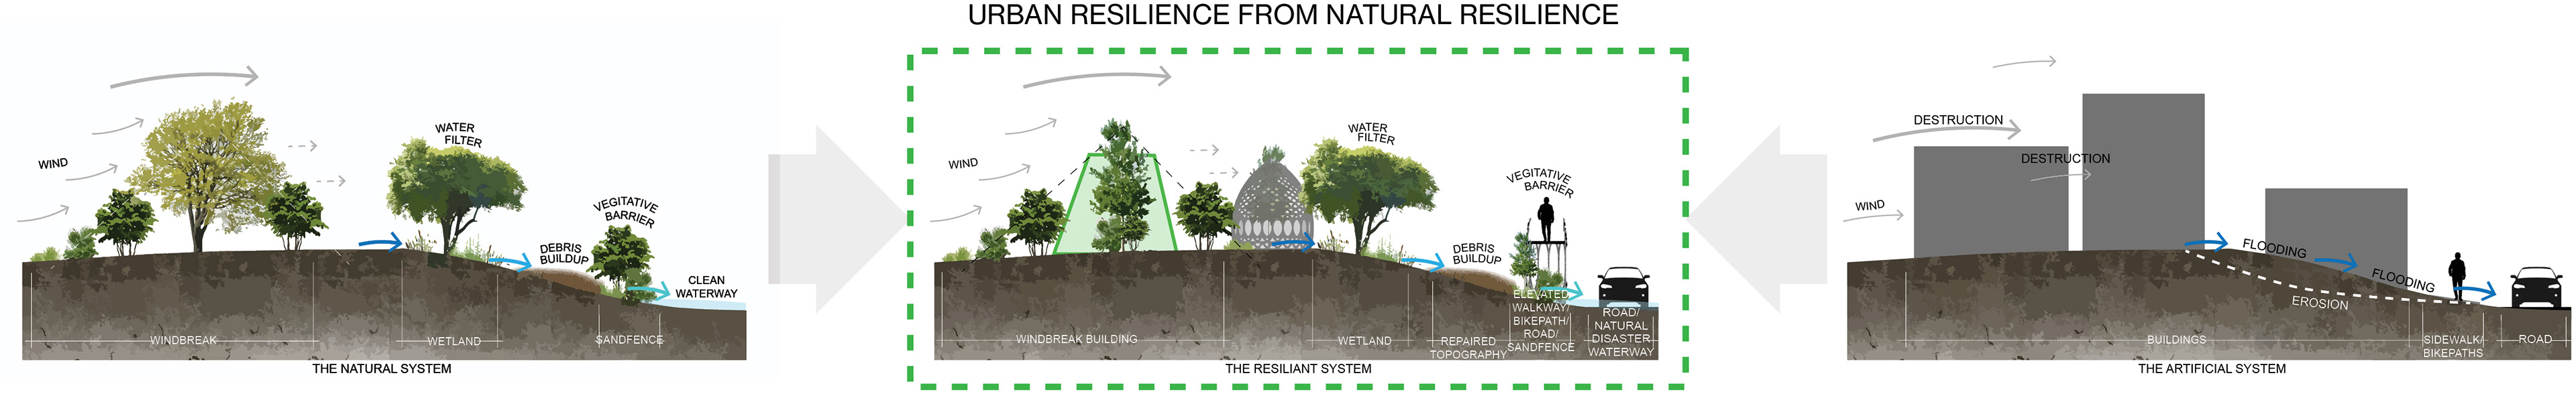

Table drawing connections between the three major nature-design organizations and the goals of biomimicry.
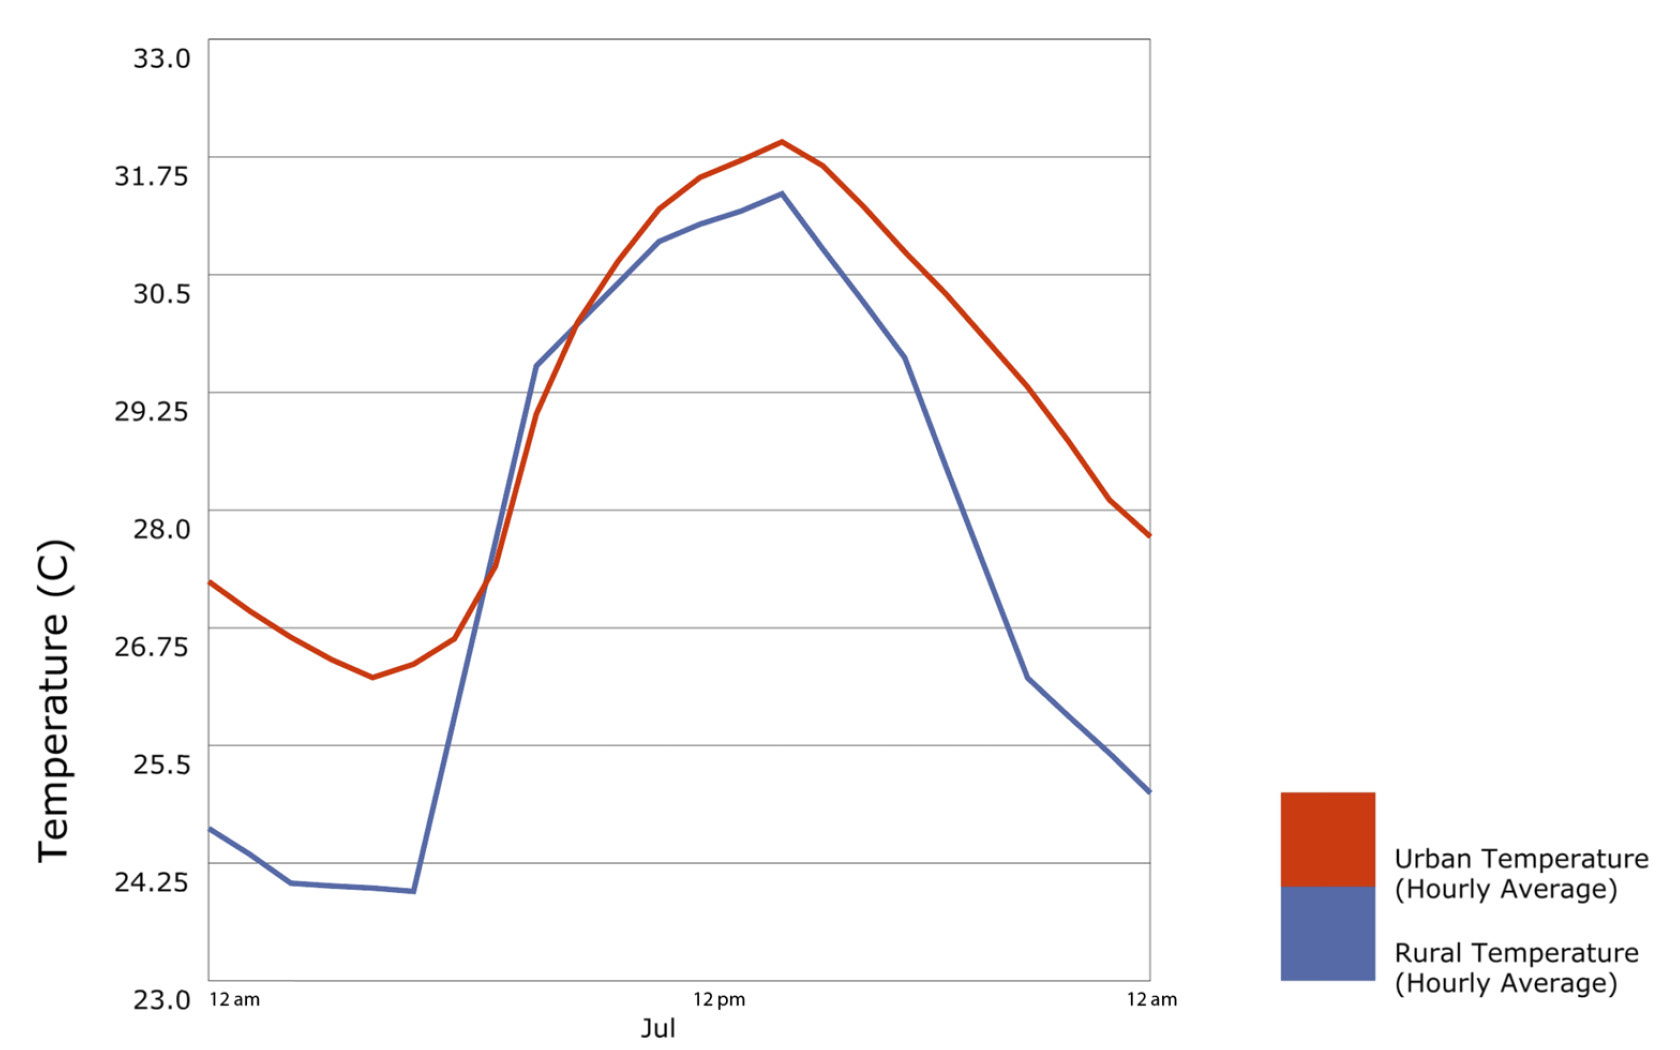
This graph shows the problem of urban heat island. The urban center stays hotter for longer than the rural areas surrounding the city.
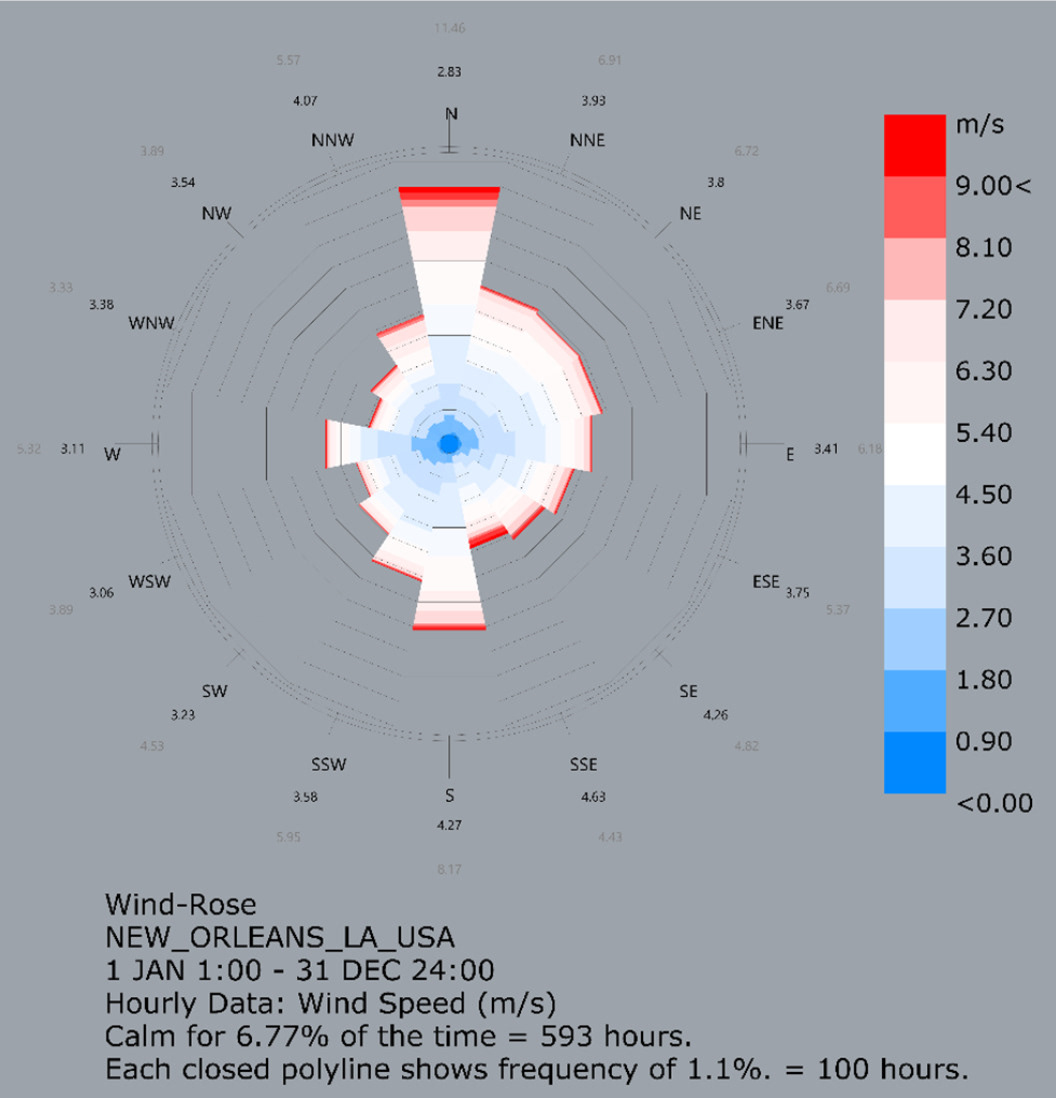
The wind rose shows a northerly and southernly winds with speeds going as high as 9 m/s or 20 mph (considered a fresh breeze). However, during a hurricane the winds can go over 74 mph. Tropical depressions are considered for wind speeds of 38 mph or less and tropical storms are for wind speeds ranging between 39-73 mph.
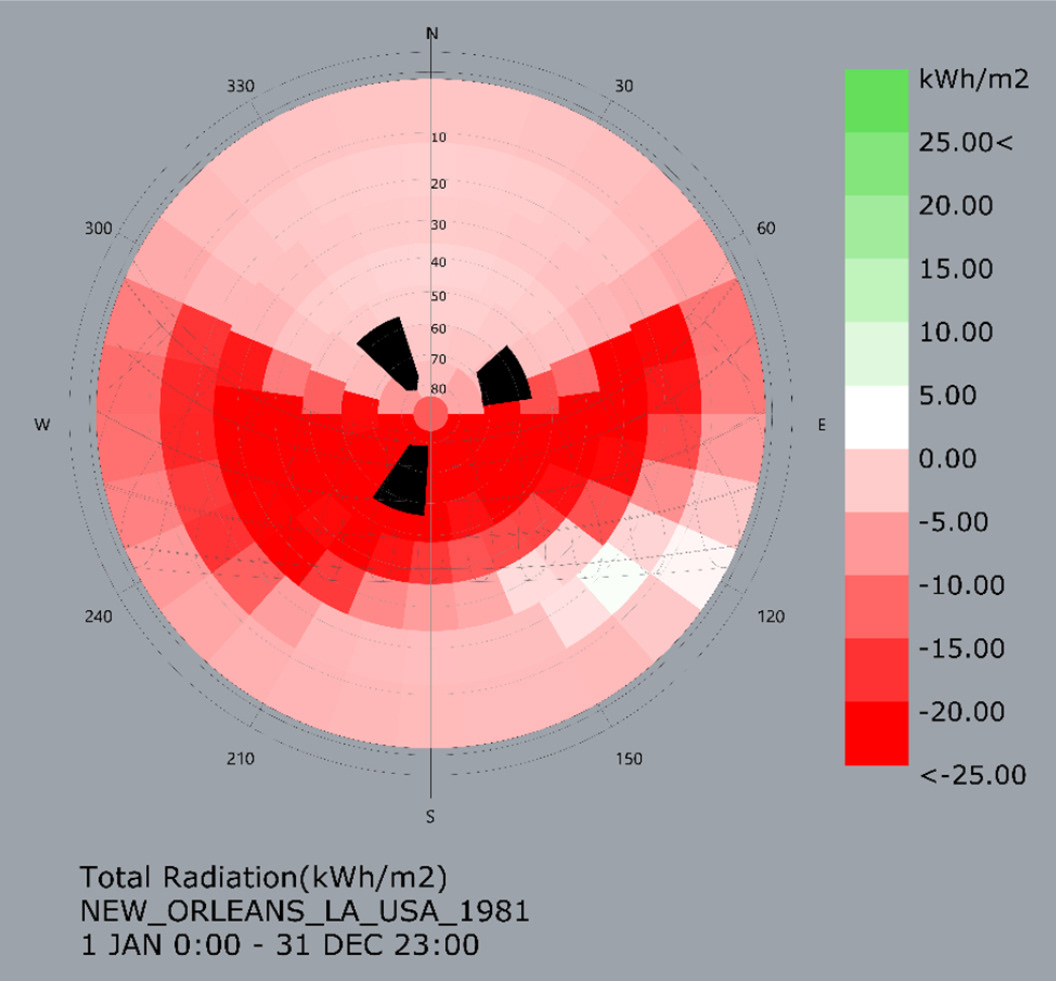
This radiation diagram shows that there are potentially dangerous levels of sun exposure year round.
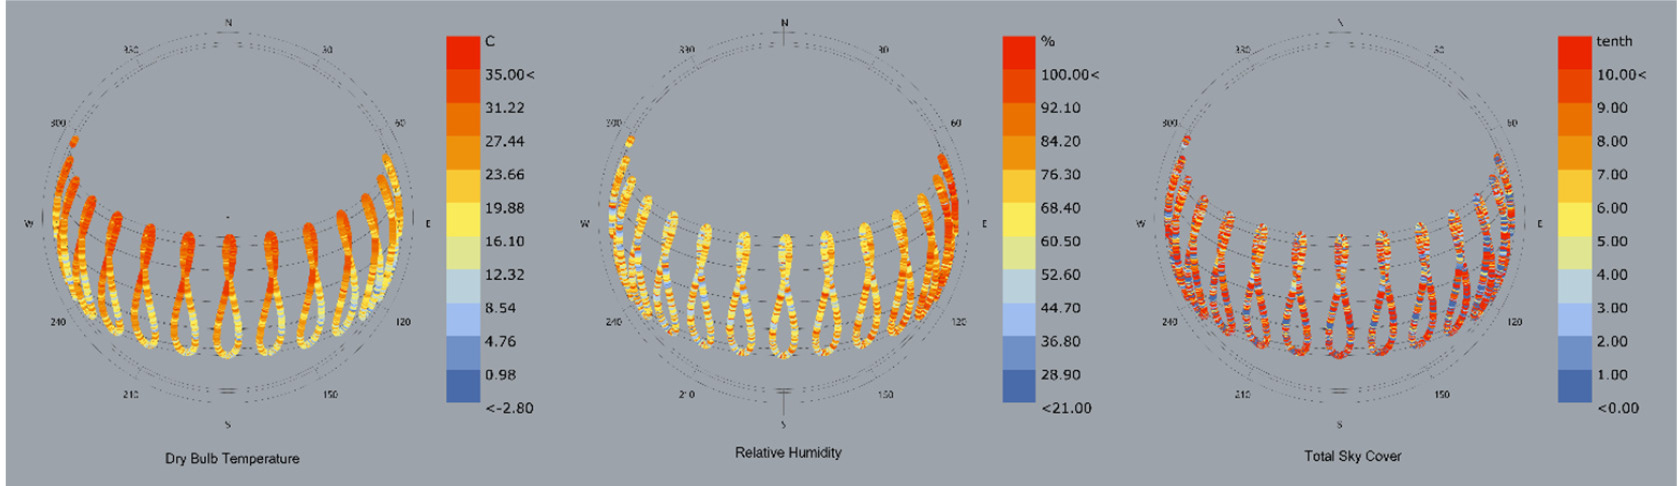
Sun path diagrams. To the left is the sun path diagram for dry bulb temperature, center is relative humidity, and to the right is total sky cover. These diagrams show that the coldest period are early in the year, it is most humid early in the day, and cloud cover is predominately in the winter seasons.

Pschrometric Chart shows Comfortable Hours in Comfort Polygon, Comfortable Hours in Evaporative Cooling Polygon, Comfortable Hours in Thermal Mass + Night Vent Polygon, Comfortable Hours in Occupant Use of Fans Polygon, Comfortable Hours in Internal Heat Gain Polygon, and Comfortable Hours in Dessicant Dehumidification Polygon.
The above diagrams for New Orleans were created with Ladybug.